

Reach reporting nirvana


See every channel's return


Know your numbers

Your true blended return
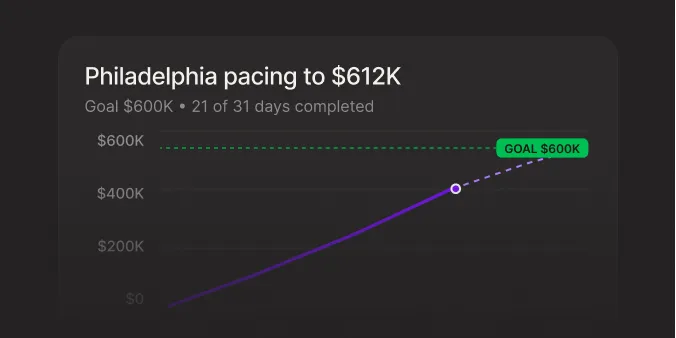
Revenue, tracked and paced

Your site and search

Know the moment performance moves

Want data? Just ask.


Hold your agency accountable


Your must-know morning digest

Catch anomalies early


Go beyond the benchmark
Got questions about Reporting Sidekick?
What can Reporting Sidekick report on?
Reporting Sidekick, the marketing reporting software in Pip by Passionfruit, reports on spend, clicks and return from every ad platform you connect, blended ROAS and TACoS (total advertising cost of sale), revenue across your stores, and your web analytics and Search Console data. It works across GA4, Google Ads, Instagram, Facebook, Bloomreach, Salesforce, HubSpot, RetailNext, CallRail, and more, explains what changed and why, then produces board-ready reports and decks without a BI ticket.
How is it different from another marketing dashboard?
Reporting Sidekick tells you what changed and why, where a dashboard leaves your team to interpret a set of charts. And because Pip by Passionfruit integrates with your entire marketing stack, you can finally see every number in one aggregated view. You'll no longer be stitching together multiple reports and guessing which campaign influenced which result. It compares each period with the last: what moved, in which direction, by how much and whether it's worth your attention. You can ask follow-up questions in plain English, such as which landing page converts best, and the full analysis is a click away, from device breakdowns to funnel drop-off and conversion rate investigations.
Can we check where the numbers came from?
Yes. Every report states the channel, store, date range and attribution window behind the numbers. Reporting Sidekick can also check an agency's claims, such as a drop in cost per lead, against your live ad accounts and tell you if the numbers don't add up, so you walk into your next meeting with your facts straight. You'll be able to trace sessions, contacts and deals back to the campaigns that drove them.
Can it answer questions from our own data warehouse?
Yes. You can query your live data warehouse, GA4 properties and ad accounts in plain English, or drop in an Excel file to analyze, with no SQL needed. Pip connects to warehouses such as Snowflake, Amazon Redshift, Microsoft Fabric, PostgreSQL and SQL Server, and to BI tools such as Domo. Pip can run any query you like, but it only writes to your warehouse once you approve the change, so nothing is deleted, overwritten or altered without your say-so. Your data stays in a walled garden.
Can we receive reports without asking every time?
Yes. Reporting Sidekick runs reports on a schedule as well as on demand, and a morning digest gives you the headlines that matter, with the full breakdown a click away. It also learns the normal range for each market and metric and flags anything that drifts, with the reason attached, in your feed and your inbox. Each insight is weighted by severity, so the most urgent ones rise to the top. You can automate your reporting daily, weekly or the moment you ask.
